Watch more videos
-
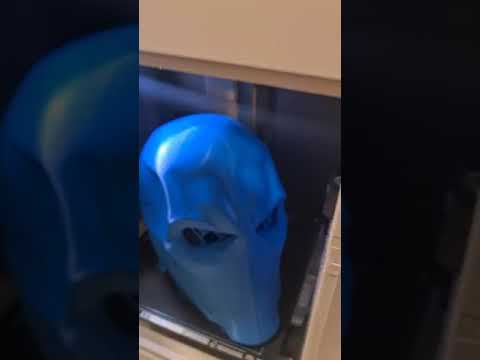 DeathStroke BambuLab X1C #Shorts
#shorts DeathStoke wearable mask made with BambuLab X1C #3dprinting -
 Enduro Rally 2021 - Pabradė military base
Had a wonderful opportunity to be in a very dirty place on a badly rainy morning but with great a... -
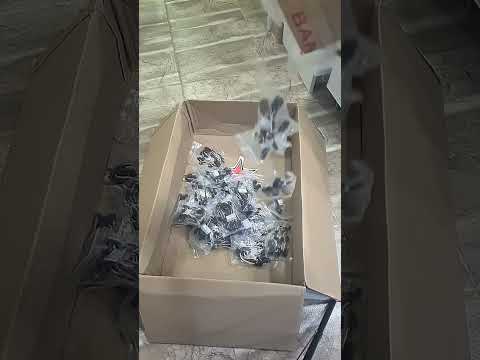 #Shorts massive servo wire attack
About 200 packs and 1000 servo leads in free fall For many many many planes to build! #shorts ...